Example of use of the MAX30102 heartrate sensor with MicroPython on a Raspberry Pi Pico. This example is based on this Maxim MAX30102 driver. The MAX30102 is an integrated pulse oximetry and heart-rate monitor biosensor module. Check out its datasheet here.
The driver used is written for the MAX30102 and might work for the MAX30105 also. Make sure to check your sensor for that (its written on it).
If you have not setup Python and an editor yet, see this guide “Getting started with MicroPython on Raspberry Pi Pico”.
Connecting the sensor
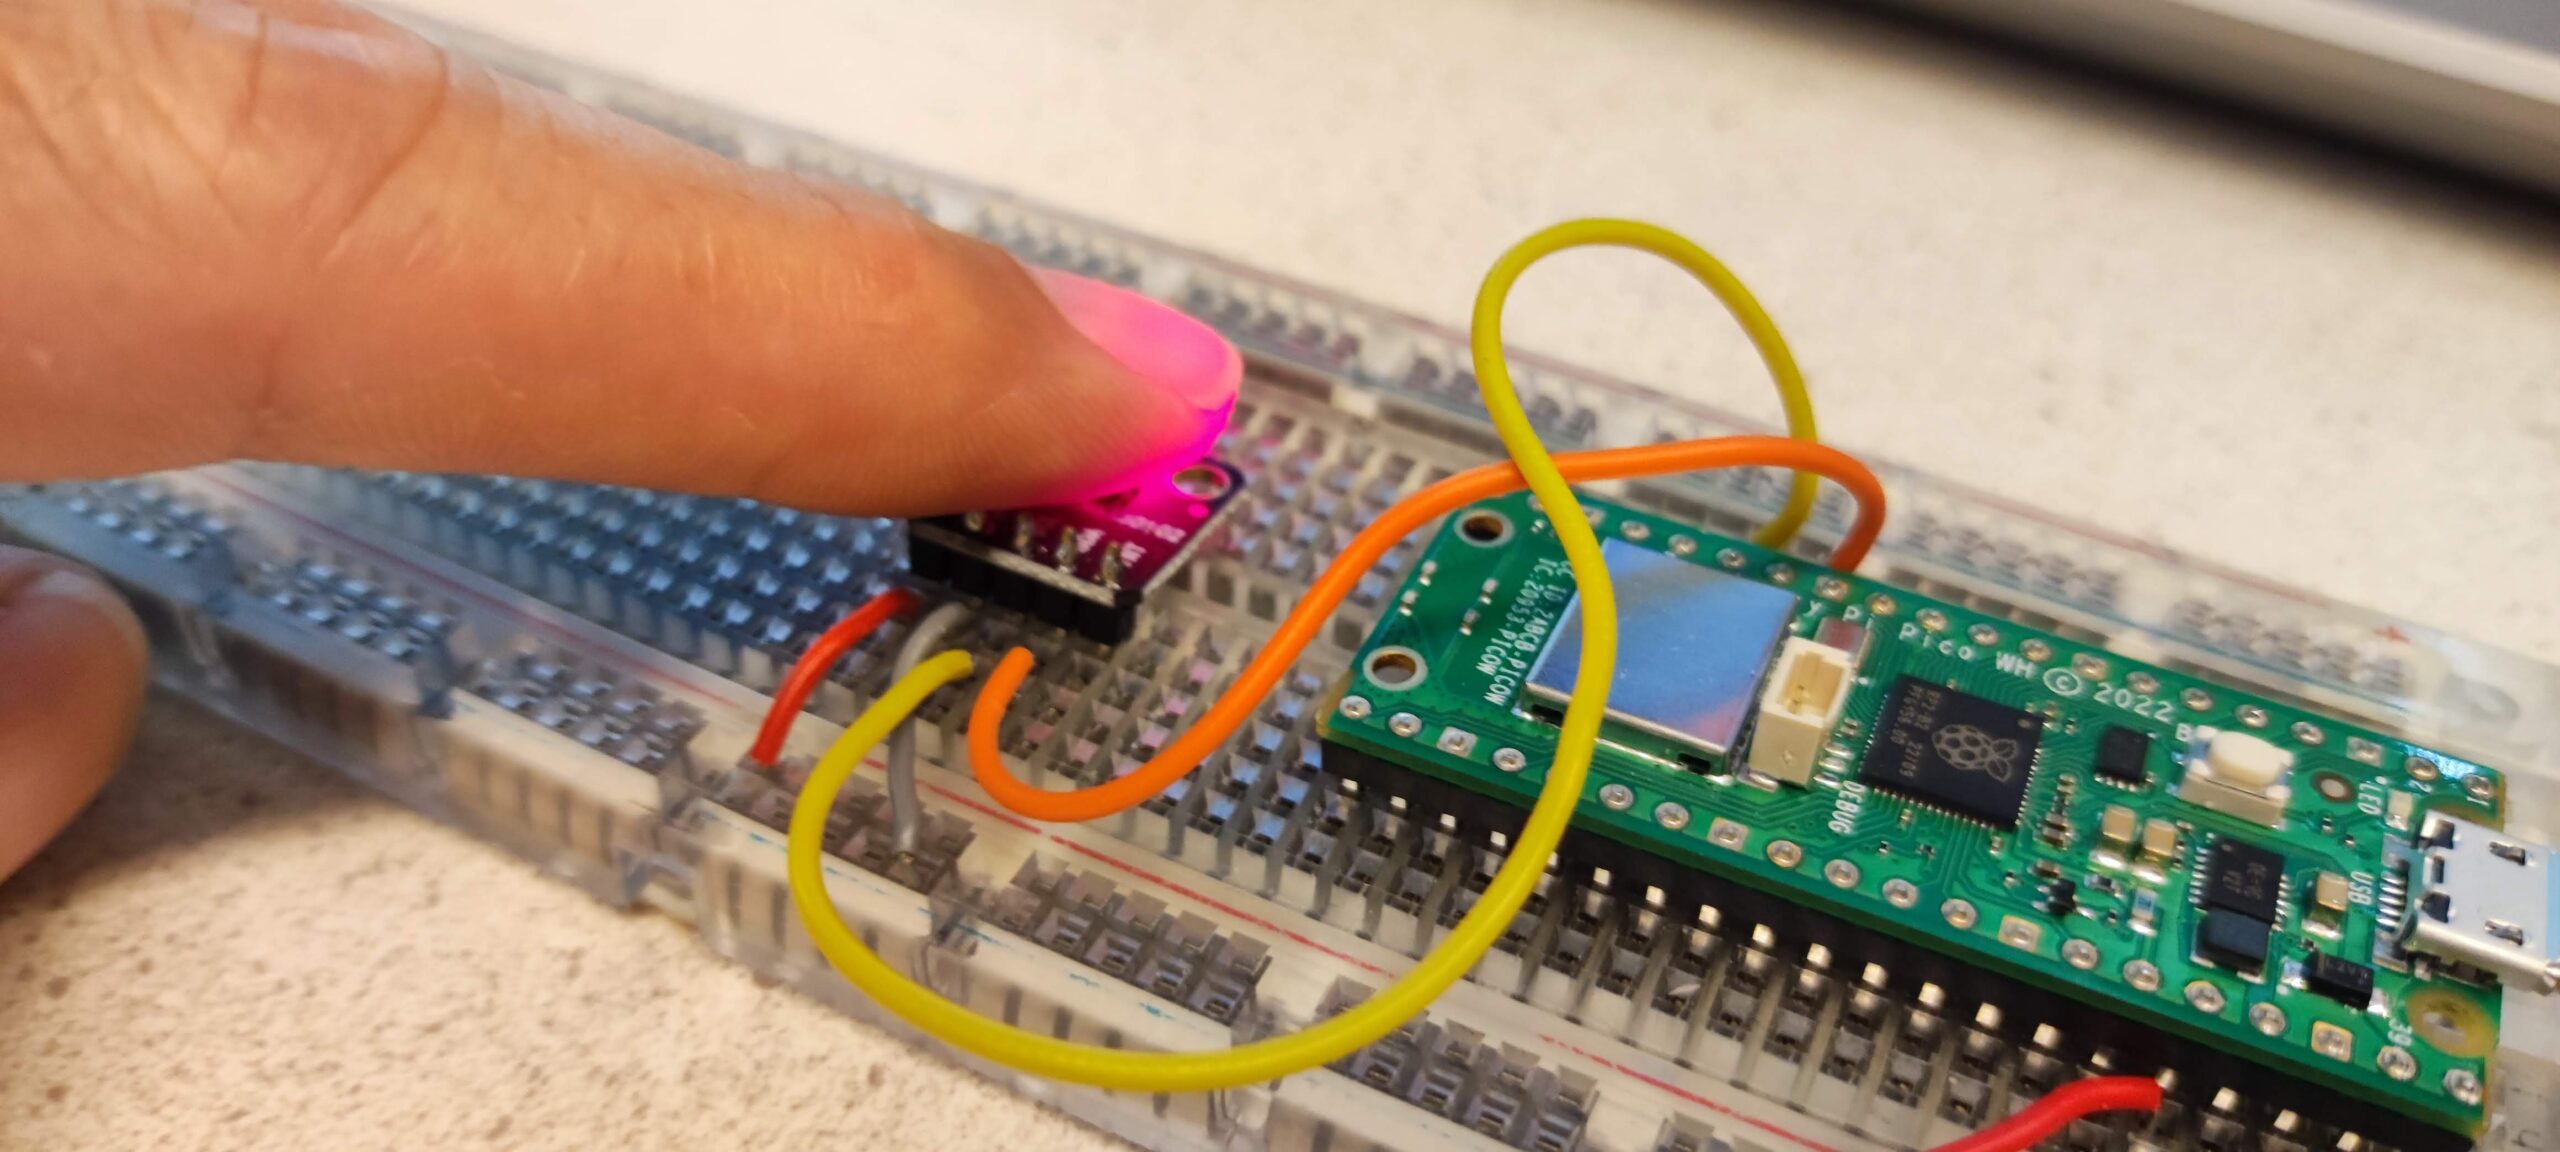
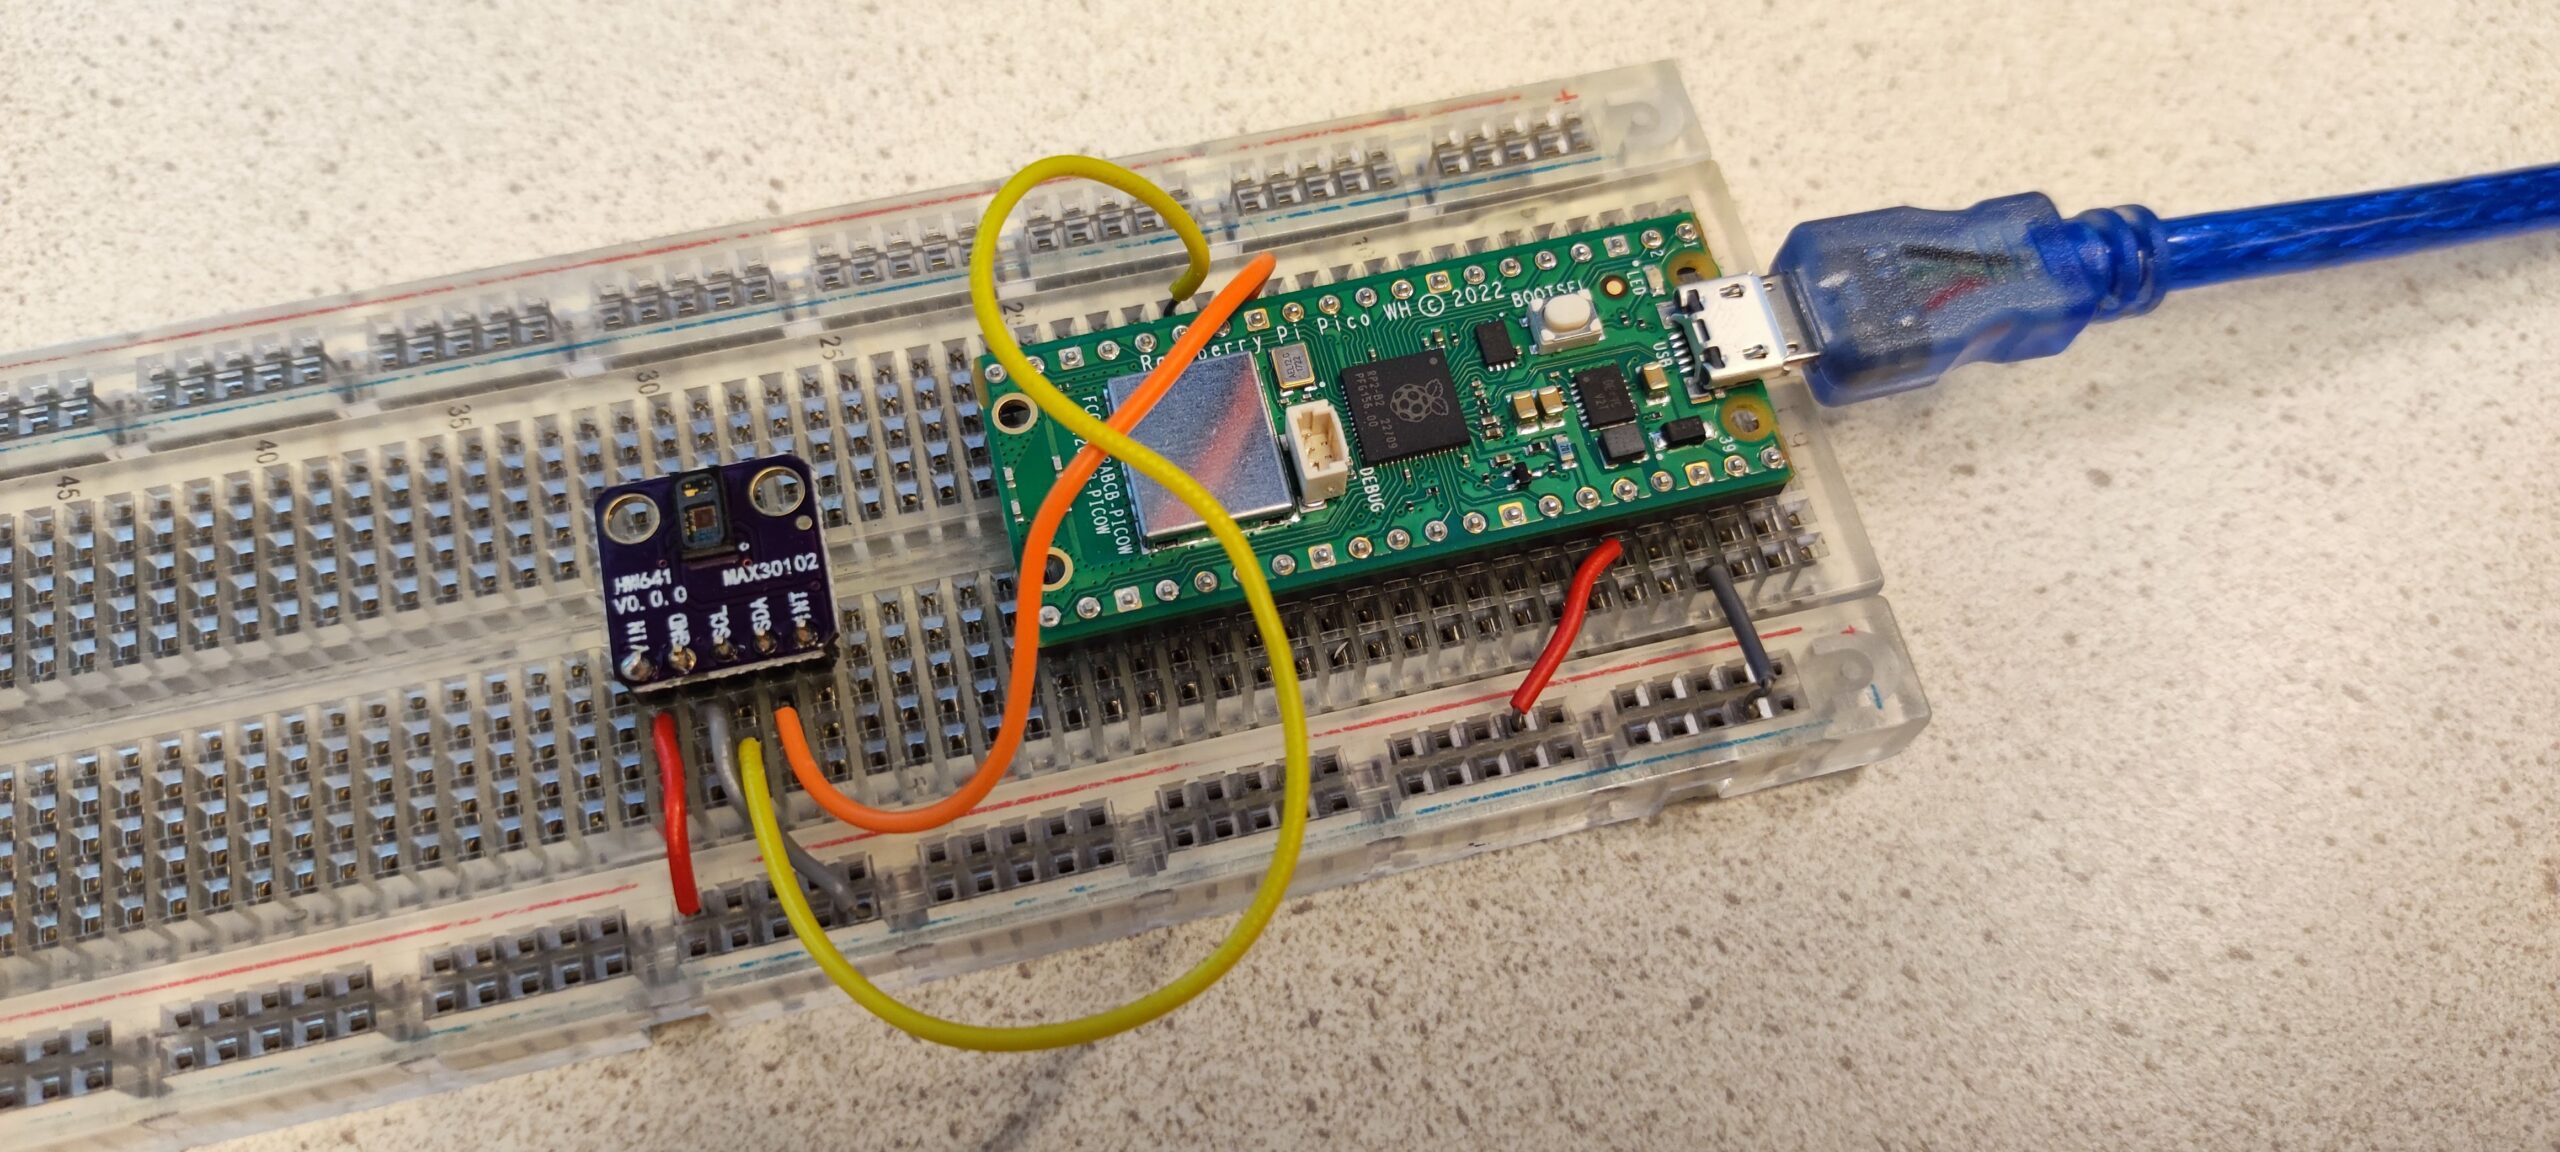
Place the sensor on a breadboard, and wire the pins:
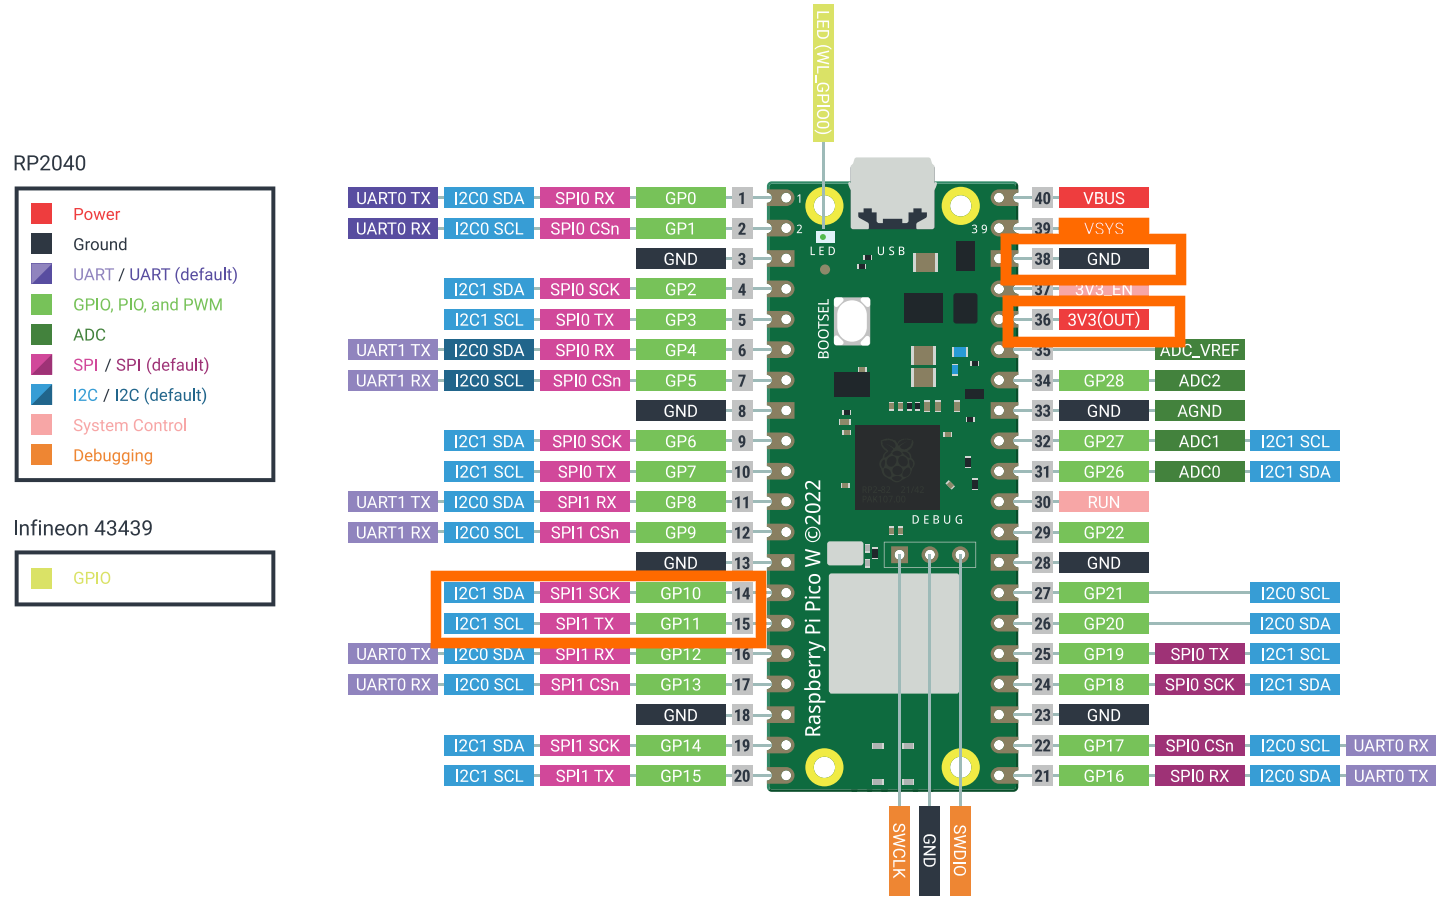
| Sensor | Pico |
| VIN | 3V3 (Out) |
| GND | GND |
| SDA | I2C1 SDA (GP 10) |
| SCL | I2C1 SCL (GP 11) |
Check the sensor type you have, as you can see below, this one has MAX30102 clearly written on it. If you have the MAX30100 this tutorial will not work for you. Instead, see this tutorial for the MAX30100.

Download and test code example
You may download this example project here. It can be used in for instance Visual Studio Code (with Pico extension) or in Thonny.
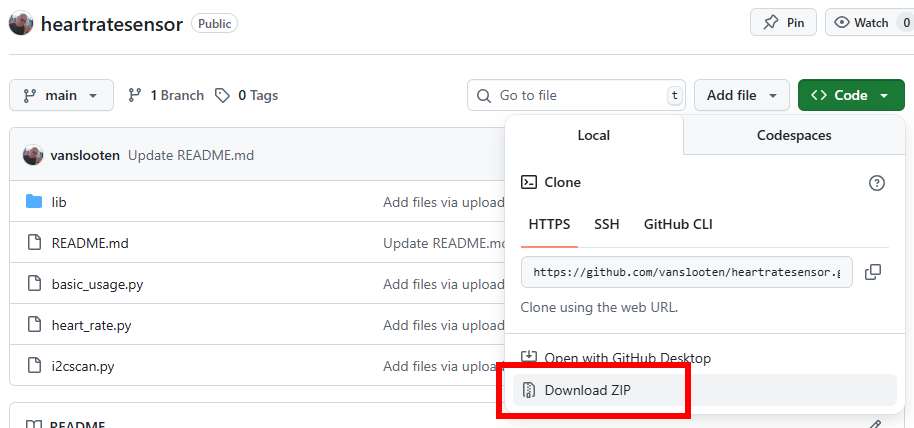
Extract the zip-file and open the folder. The script i2scan.py can be used to see if there is an i2c connection with the sensor. If there is, it displays the address of the sensor, usually [87].
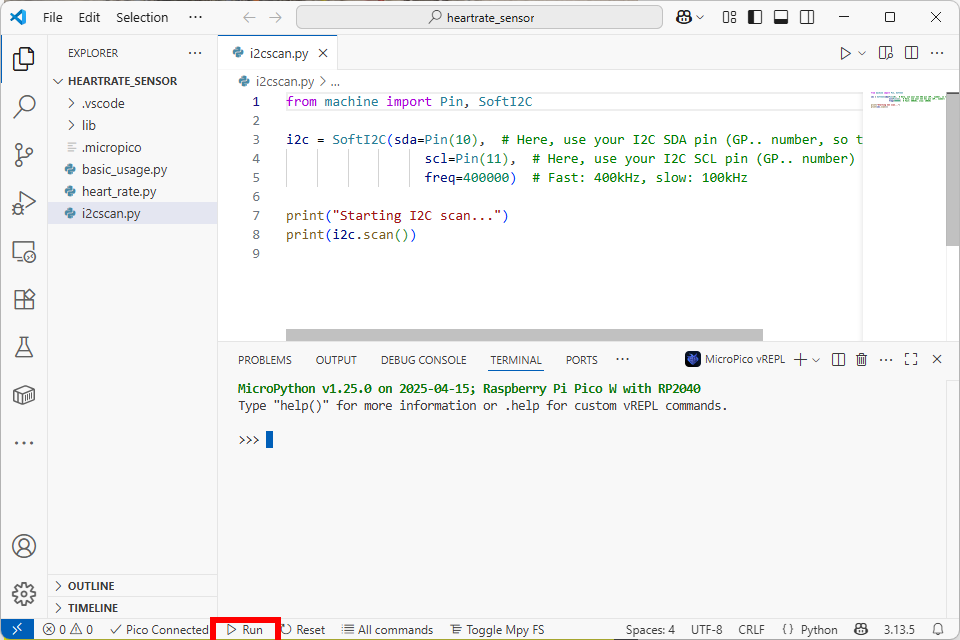
Before you can run the other scripts, you must upload the lib folder to the Pico, as that contains the max30102 library. In Visual Studio Code, you can do this via “All commands” on the bottom bar, choose “MicroPico: Upload project to Pico”:

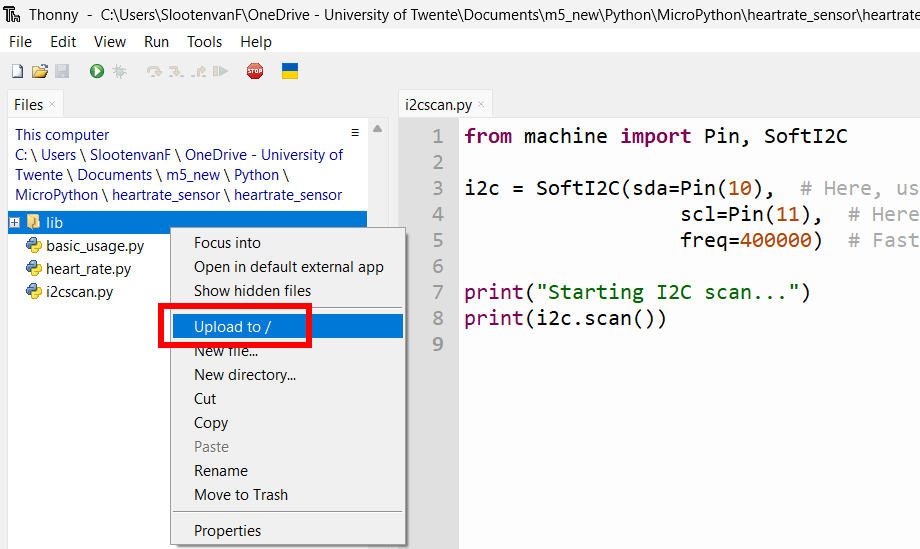
In Thonny, right click the lib folder and choose “Upload to /” (you may also select all files and folders in a project to upload it entirely):
Now give the other scripts a try (run those).
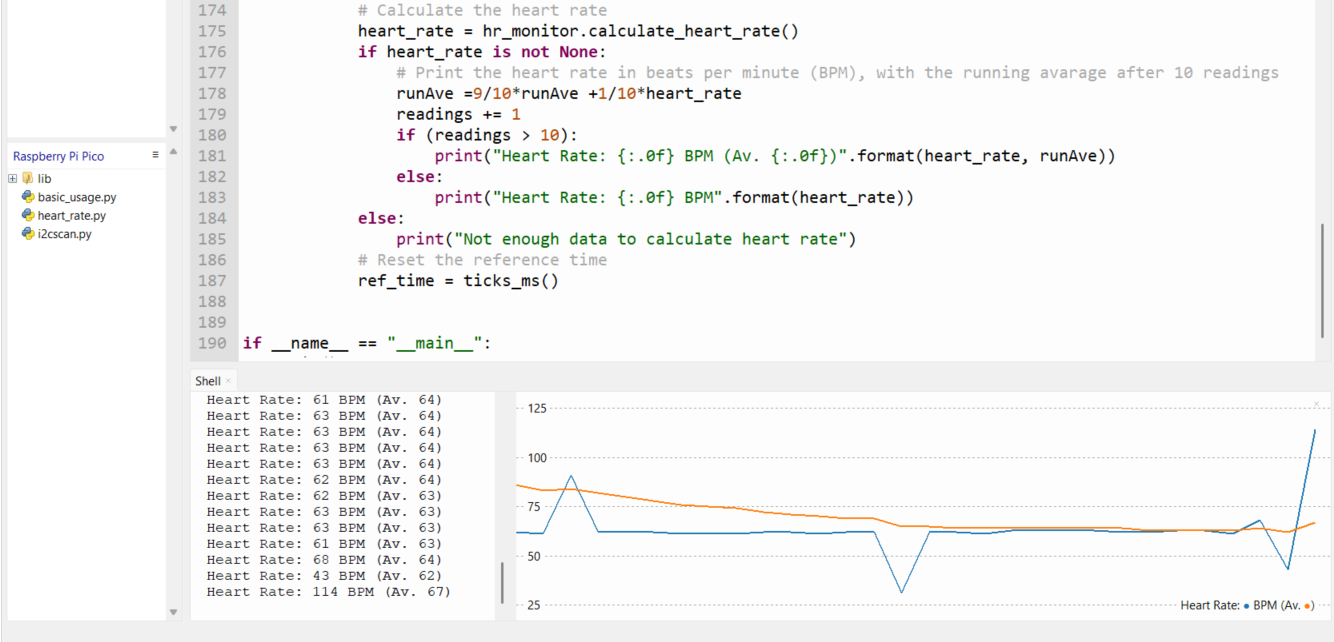
heartrate.py is the most advanced, and should be showing the heartrate in BPM:
(do not forget to put your finger on the sensor)
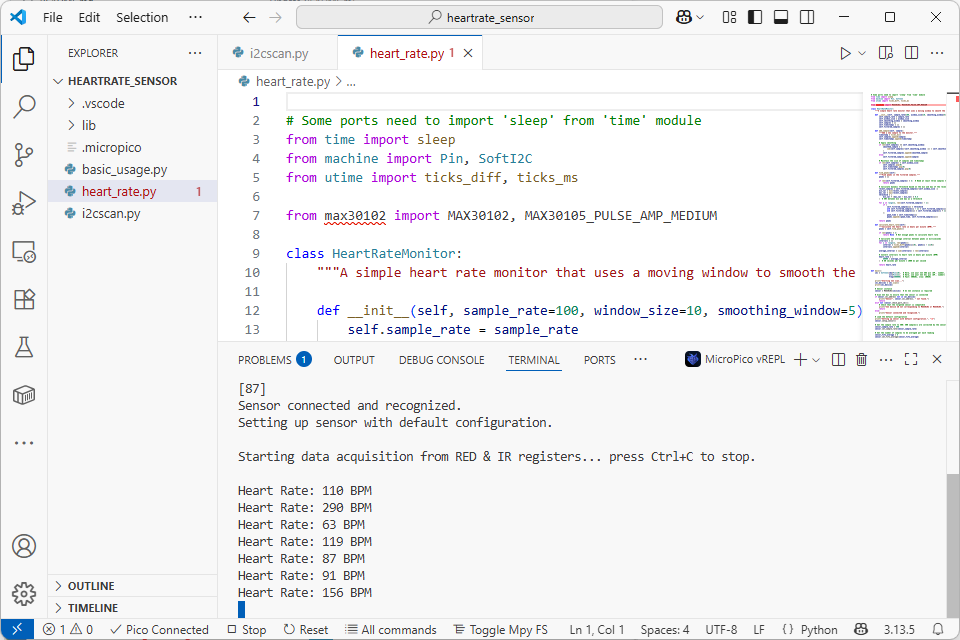
Let it run for 10 readings or more, after which it will also display the running average, which gives a better indication of the actual rate.
Apart from heart rate, the sensor can also read SPO2 data. Read the driver page for more on that. It also has hints on plotting data in CSV format and plotting graphs from that.
Plotting data
In the Thonny editor, you can visualize the heartrate using the Plotter (View > Plotter):